
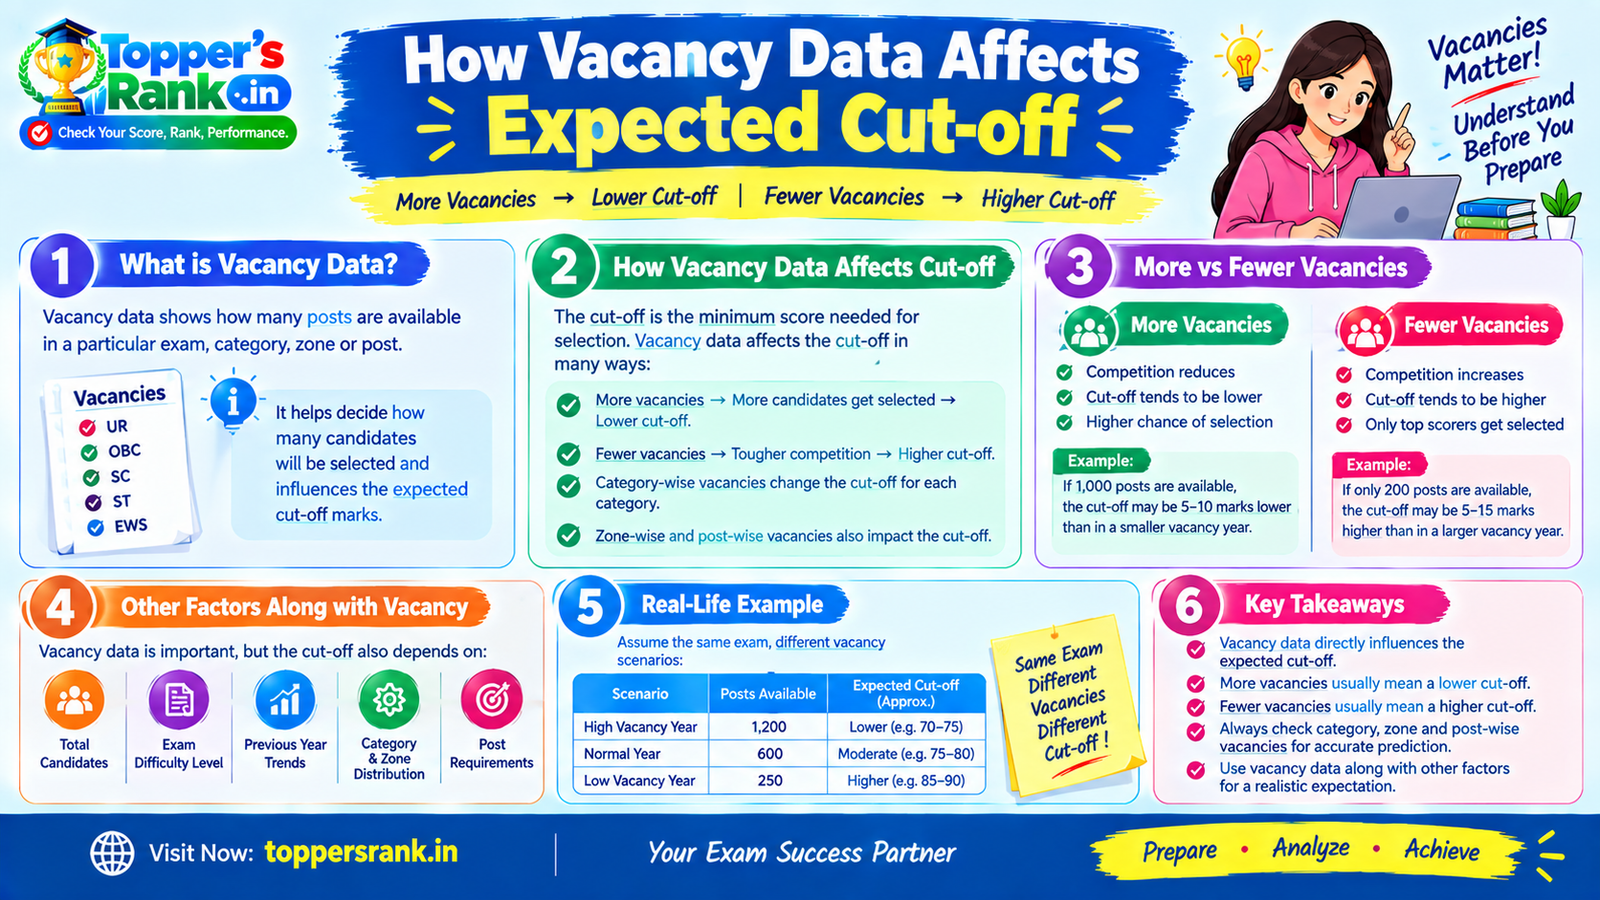
# How Vacancy Data Affects Expected Cut-off
Expected cut-off is not determined by marks alone. While candidate scores and exam difficulty are important, the number and distribution of available vacancies can significantly influence the level of competition for selection. Understanding vacancy data correctly is therefore essential when analyzing an expected cut-off.
For candidates, the key point is simple: the same score can have different implications when the vacancy structure changes. However, vacancy count should always be interpreted together with candidate volume, score distribution, category, zone, post and the rules of the particular examination.
Why Vacancy Count Matters for Expected Cut-off
A cut-off represents a score boundary associated with a particular selection or qualification process. When the number of vacancies changes while the candidate pool and other conditions remain broadly similar, the competitive pressure can also change.
For example, when there are more vacancies and the number and performance of candidates remain relatively similar, a larger number of candidates may fall within the available selection range. This can reduce the pressure around the estimated cut-off.
On the other hand, when vacancies are limited, the number of candidates competing for each available seat can increase. In such a situation, the estimated cut-off may remain high even when the examination itself was considered difficult.
This is why looking at marks alone does not provide a complete picture.
A simple illustration
Consider two hypothetical situations for the same examination:
| Scenario | Candidates | Vacancies | Possible Competitive Pressure | | -------- | ---------: | --------: | --------------------------------- | | A | 100,000 | 10,000 | Relatively broader selection pool | | B | 100,000 | 5,000 | Narrower selection pool |
These figures are only illustrative. They do not predict an actual cut-off. They simply demonstrate why vacancy levels are an important variable in merit analysis.
---
# Vacancy Data Is More Than a Total Number
One of the most common mistakes in cut-off analysis is using the total vacancy figure without checking how those vacancies are distributed.
An official recruitment notice may provide vacancy information at several levels, including:
- Total vacancies
- Category-wise vacancies
- Zone-wise vacancies
- Post-wise vacancies
- Railway or unit-wise vacancies
- Horizontal reservation details
- Other recruitment-specific classifications
These figures are not interchangeable.
For example, OBC vacancies in one railway zone are not the same as total OBC vacancies across all zones. Similarly, vacancies for one post should not automatically be combined with vacancies for another post when the selection process treats them separately.
A reliable calculator or analysis system must preserve these distinctions rather than combining every vacancy field into one figure.
---
# Category-Wise Vacancy Data and Cut-off Analysis
Category-wise vacancy information can be particularly important where the recruitment process uses separate reservation or qualifying rules.
Suppose an examination provides vacancies for:
- UR
- OBC
- EWS
- SC
- ST
The relevant competition may differ across these groups depending on the number of candidates, score distribution and available seats.
Therefore, a candidate analyzing an OBC expected cut-off, for example, should not automatically use the total number of vacancies for all categories.
The analysis should use the vacancy figure that actually corresponds to the applicable recruitment category and selection structure.
---
# Zone-Wise Vacancies Can Change the Competitive Picture
Some recruitments divide vacancies by railway zone, board, region, state or another administrative unit.
In such cases, a national or overall vacancy count may not accurately describe the competition relevant to a particular candidate.
Consider a simplified example:
| Zone | Vacancies | | ------ | --------: | | Zone A | 1,000 | | Zone B | 500 | | Zone C | 250 |
If candidates are being considered within separate zones, the relevant competition for a candidate may depend on the vacancy structure of the selected zone rather than the combined total of all three zones.
This is why zone-wise vacancy mapping can be important when calculating an expected cut-off.
---
# Post-Wise Vacancy Data Also Matters
Vacancies may also be distributed across different posts.
A recruitment could include several posts with different eligibility requirements, vacancy counts or selection rules. Combining those vacancies into one total may produce a misleading picture.
For example:
| Post | Vacancies | | ------ | --------: | | Post A | 800 | | Post B | 300 | | Post C | 100 |
A candidate applying or being considered for Post B should not assume that all 1,200 vacancies are relevant to their selection.
The expected cut-off should therefore be analyzed using the vacancy structure that actually applies to the candidate's post.
---
# Why Vacancy Distribution Matters More Than a Single Total
Two recruitment cycles can have the same total vacancy count but very different vacancy distributions.
For example:
Year 1: 10,000 total vacancies spread broadly across several zones and categories.
Year 2: 10,000 total vacancies concentrated in a smaller number of zones or posts.
Although the total is identical, the competitive environment may not be identical.
This is why a good vacancy analysis should consider not only:
“How many vacancies are there?”
but also:
“Where are those vacancies located, which categories do they belong to, and which posts do they apply to?”
---
# How a Vacancy-Based Expected Cut-off Calculator Should Work
When an administrator uploads an official vacancy PDF, spreadsheet or structured vacancy file, the system can organize and summarize the available information.
A useful system may provide:
Total Vacancy Summary
The overall number of vacancies contained in the dataset.
Category-Wise Vacancy Summary
Vacancies separated by applicable reservation categories.
Zone-Wise Vacancy Summary
Vacancies grouped by railway zone, board or other recruitment unit.
Post-Wise Vacancy Summary
Vacancies grouped by the relevant post.
Filtered Vacancy Summary
The vacancy count matching the candidate's selected category, zone and post.
This approach helps prevent one of the most common analytical problems: mixing vacancy figures from different levels of the recruitment structure.
---
# Why the Calculator Should Not Always Show a Precise Expected Cut-off
Having vacancy data does not automatically mean that a reliable cut-off can be predicted.
A cut-off model may also require enough candidate-level information to understand:
- Score distribution
- Number of candidates
- Category distribution
- Zone distribution
- Post distribution
- Competition intensity
- Other relevant examination-specific factors
If the candidate sample is too small, the system may have insufficient evidence to produce a meaningful estimate.
For example, if only a small number of candidates have submitted their scores, a calculator could technically produce a number—but that number may give a false impression of precision.
A better approach is to communicate uncertainty through:
- Expected ranges
- Data coverage
- Sample size
- Update date
- Methodology notes
---
# Sample Size Is Critical to Cut-off Prediction
Suppose a recruitment has hundreds of thousands of applicants, but only 500 candidate scores have been voluntarily submitted to a calculator.
Those 500 records may provide useful information, but they are still a sample, not the complete candidate population.
The system should therefore distinguish between:
Official vacancy data
and
Observed candidate sample data
This distinction helps candidates understand why an expected cut-off can change as more responses are collected.
---
# Why Expected Cut-off Can Change Over Time
Expected cut-offs should generally be viewed as time-sensitive estimates.
As new information arrives, the analysis may change because:
- More candidate scores are submitted.
- Score distributions become clearer.
- Additional vacancy details are published.
- Answer keys are revised.
- Normalization information becomes available.
- Category or zone information is updated.
- Recruitment authorities issue corrections.
A cut-off estimate published early after an examination may therefore differ from a later estimate based on a larger and more complete dataset.
---
# Exam Difficulty and Vacancy Data Must Be Read Together
Vacancies are only one part of the analysis.
Suppose an examination is unusually difficult but has very few vacancies. The low difficulty of the paper does not automatically mean that the cut-off will be low.
Conversely, a relatively difficult examination with a larger vacancy pool may produce a different competitive environment.
A more realistic analysis considers multiple factors together:
Candidate Scores + Exam Difficulty + Candidate Count + Vacancy Distribution + Category + Zone + Post + Applicable Rules
This is why vacancy data should support cut-off analysis rather than replace it.
---
# Other Factors That Can Affect the Final Cut-off or Selection
Even a carefully prepared expected cut-off is not the same as the final official outcome.
Depending on the examination and recruitment rules, later stages may involve factors such as:
- Normalization or moderation
- Attendance or absenteeism patterns
- Category-wise eligibility
- Document verification
- Medical requirements
- Candidate preferences
- Post or zone allocation rules
- Tie-breaking provisions
- Revised vacancy figures
- Final decisions of the recruiting authority
Not every factor applies to every examination, so candidates should consult the relevant official notification.
---
# How Students Should Use Vacancy Data
Candidates can use vacancy information as a planning and analysis tool, rather than as a guarantee of selection.
A sensible approach is to:
Check the official vacancy source
Use the latest official notification or vacancy update available for the examination.
Identify the correct vacancy level
Determine whether the relevant figure is overall, category-wise, zone-wise, post-wise or a combination.
Compare vacancy data with candidate trends
Look at score distribution and available candidate data rather than relying on vacancies alone.
Consider the size of the available sample
Understand whether the estimate is based on a broad dataset or a small voluntary sample.
Treat the result as an estimate
Expected cut-offs are not official cut-offs.
Monitor updates
Vacancy and candidate data can change as the recruitment progresses.
---
# A Practical Example
Imagine an examination with the following simplified data:
| Factor | Scenario A | Scenario B | | ------------------- | ---------: | ---------: | | Candidates | 100,000 | 100,000 | | Vacancies | 10,000 | 5,000 | | Average Score Trend | Similar | Similar | | Exam Difficulty | Similar | Similar |
All else being similar, Scenario B has fewer vacancies available for the same broad candidate population. That can increase competitive pressure around the selection boundary.
However, this does not mean the cut-off can be calculated simply by dividing candidates by vacancies. Actual cut-offs depend on the score distribution, selection rules, categories, vacancy allocation and other examination-specific factors.
---
# What a Transparent Cut-off Calculator Should Show
A professional score-analysis tool should make its assumptions visible.
Ideally, the result page should show:
Expected Cut-off: Estimated range Data Date: Date on which the estimate was calculated Candidate Sample: Number of responses analyzed Vacancies Used: Relevant vacancy count Category: Selected category Zone: Selected zone, where applicable Post: Selected post, where applicable Methodology: Brief explanation of the calculation Disclaimer: Estimate only; official authority result prevails
This makes the analysis easier to understand and reduces the risk of treating an estimate as an official result.
---
# Final Takeaway
Vacancy data is one of the most important inputs in expected cut-off analysis, but it is not the only one. More vacancies can reduce competitive pressure under otherwise similar conditions, while fewer or highly concentrated vacancies can increase the pressure around the selection boundary.
The most accurate analysis comes from combining vacancy data with candidate scores, competition trends, exam difficulty, category, zone, post and the official selection rules.
When vacancy information is uploaded into a calculator, the system should preserve the original structure and distinguish between total, category-wise, zone-wise and post-wise vacancies. A precise expected cut-off should also be avoided when the available candidate sample is too small to support a meaningful estimate.
Most importantly, candidates should use an expected cut-off as a planning reference, not a guaranteed result. The final qualifying marks, merit position and selection outcome are determined through the official recruitment process and may be affected by later updates, normalization, allocation rules, document verification, medical requirements and other applicable conditions.
 Exam Guidance · 16 minHow To Save And Use Your Score Card Safely
 Exam Guidance · 18 minRRB ALP CBT-2 Score Analysis: Part A, Part B and Merit
 Exam Guidance · 9 minOverall Rank, Category Rank and Zone Rank Explained